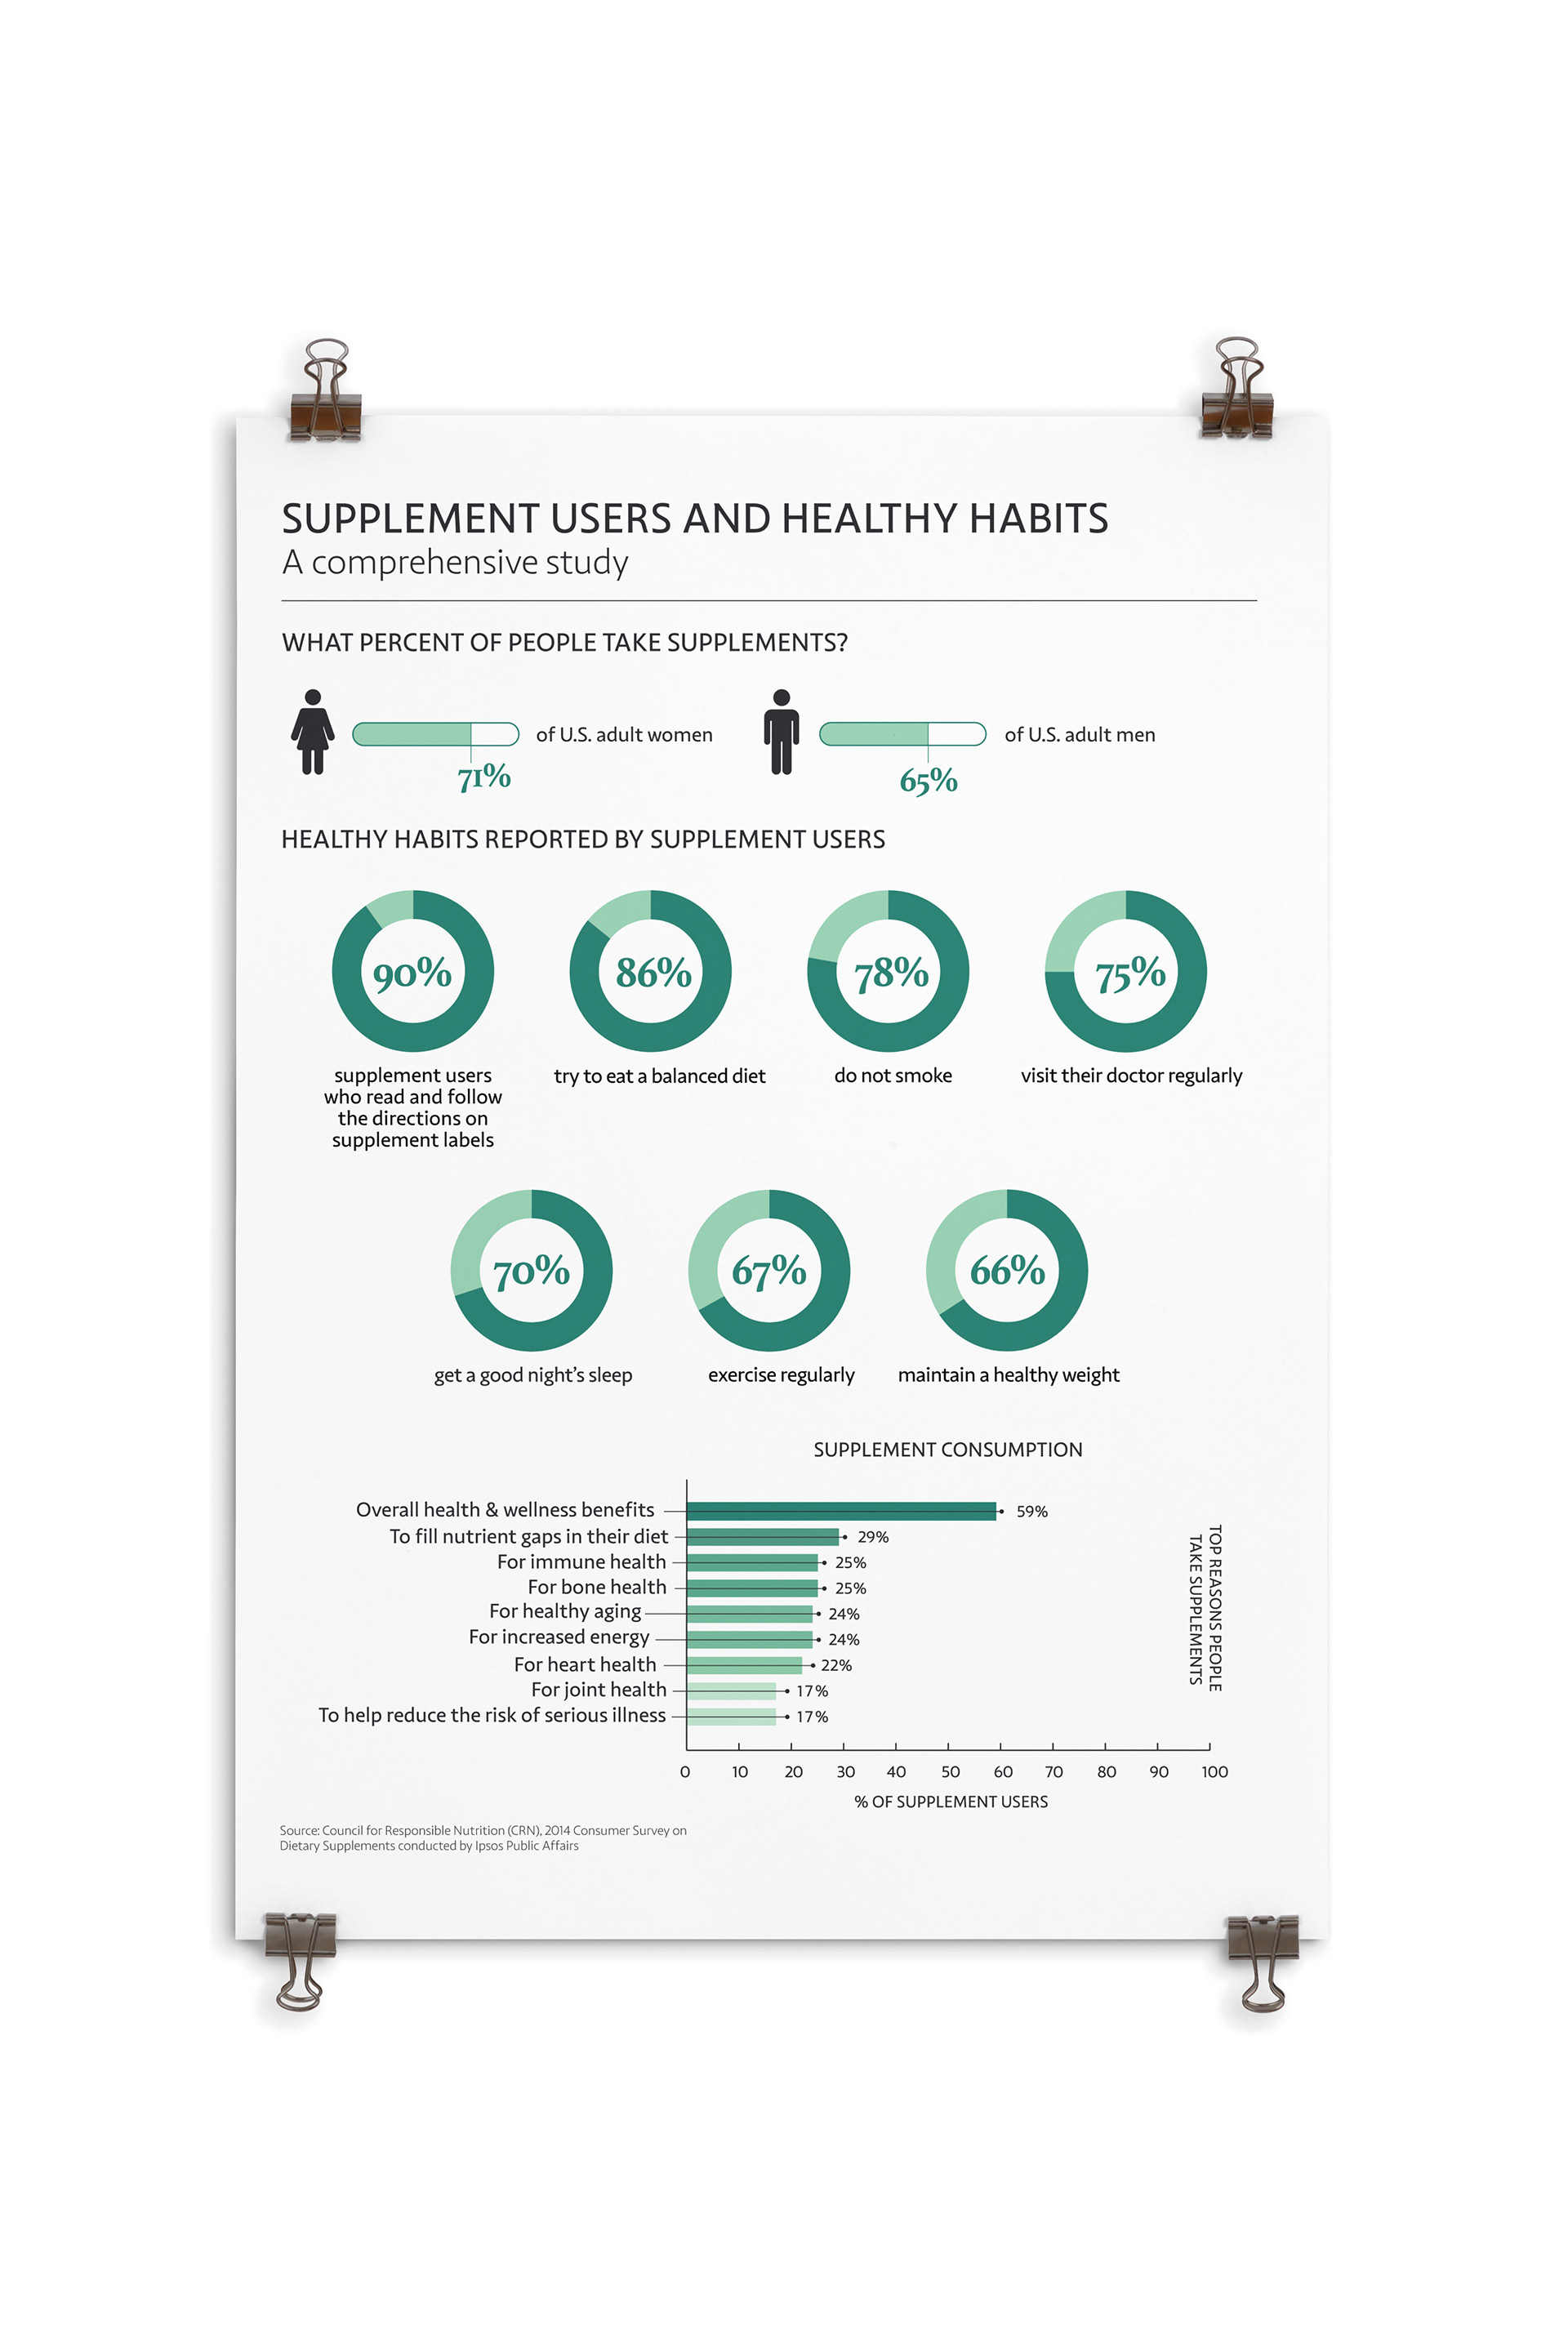
Junior year of college I reenvisioned an existing data visualization in my Design Research class. The process included interpreting the data in my own way and deciding the most effective way to represent it through different graphs. The goal of the assignment was to figure out how I could use my skills as a designer to create an aesthetic and well-communicated data visualization using the existing information provided by our professor.